Feeds:
Posts
Comments

Posts Tagged ‘DSP’

Matlab has long been an immensely convenient tool for processing and visualizing signals in a DSP system. The tool makes it very easy to simultaneously visualize a signal in multiple domains. The following is a simple demonstration of some of these signal-processing capabilities.

The Fibonacci sequence is the sequence of numbers formed when each number in the sequence is equal to the sum of the two Fibonacci numbers immediately preceding that number. The sequence is initialized by the numbers 0 and 1, and looks something like this: 0,1,1,2,3,5,8,13,21,34,55,89,144,233,377,etc. It is trivial to design a digital filter that produces the Fibonacci sequence as it’s impulse response. The impulse response of a discrete-time or digital filter is the response produced when the filter is stimulated by the Kronecker delta function:

\delta[n] = \begin{cases}                1, & n = 0 \\          	     0, & otherwise     \end{cases}

If the initial state of such a filter is such that all internal elements are at zero, the filter described by the following difference equation can produce an impulse response equal to the Fibonacci sequence. The input and output sequences are denoted x[n] and y[n], respectively.

y[n] = x[n] + y[n-1] + y[n-2]

Taking the Z-transform of this difference equation yields the following transfer function H(z) through the filter:

\begin{array}{lcl}     H(z) & = & \frac{Y(z)}{X(z)} \\          & = & \frac{1}{1 - z^{-1} - z^{-2}} \\  	& = & \frac{z^{2}}{z^{2} - z - 1}  \end{array}

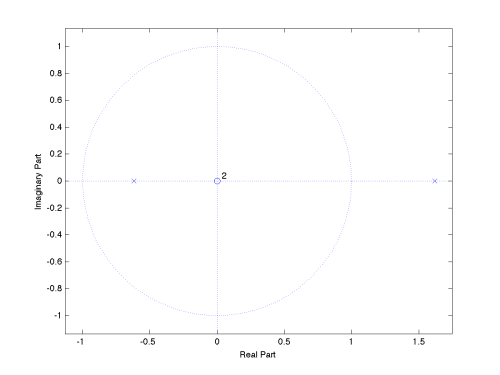
This transfer function has two zeros at the origin, and a pair of real-valued poles at z=-0.618 and z=1.618. A pole-zero plot can quickly be produced using the roots and zplane commands in Matlab:

zplane(roots([1,0,0]), roots([1,-1,-1]))

For the transfer function H(z), the coefficient matrices of the numerator and denominator polynomials in z-1 are given by B=[1] and A=[1,-1,-1], respectively. The frequency response of the filter can easily be computed using the freqz command in Matlab. In the following snippet of code, H is the complex-valued DFT and W is a vector of radian frequencies at which H has been computed. The following plot shows the magnitude of the frequency response.

% numerator polynomial
B = [1];
% denominator polynomial
A = [1,-1,-1];
% compute frequency response
[H,W] = freqz(B,A);
% plot the magnitude response (normalize W to pi)
plot(W/pi,abs(H));

The frequency response is computed along the unit circle in the Z-domain (z=ejw). Since the response is symmetric, the above plot only shows W/pi going from 0 to 1. As expected, the magnitude response shows peaks near 0 and 1, due to the relative proximity of the poles to these two points.

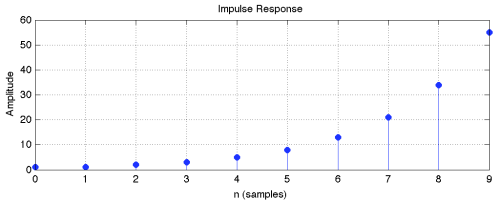
In the time-domain (or sample-domain), the response of such a system to a particular input sequence can easily be computed using the filter command in Matlab. In the following fragment of code, the above filter polynomials are used, along with initial states of zero. The input stimulus sequence x is ten samples of a Kronecker delta function, starting at n=0 and ending at n=9. The filter output y is initially 0, but then proceeds through the next ten numbers in the Fibonacci sequence.

% Kronecker delta function starting from n=0 to n=9
x = [1,zeros(1,9)];
% initial conditions of filter
init = [0,0];
% compute the filter response
y = filter(B,A,x,init);

A quicker way to compute the impulse response is through the impz command. The following line of code not only gives the first 10 values of the impulse response, it also produces a stem-line plot of the impulse response.

% compute impulse response
impz(B,A,10)

A simpler way to implement a Fibonacci sequence generator would be to discard the input x and initialize the filter to [1,0] instead of [0,0]. In any case, the Fibonacci filter example is not really practical, as the numbers increase until the internal states exceed the numerical limitations of the implemented machine. An unbounded response indicates that the filter is unstable, and this is confirmed by the location of a pole outside the unit circle in the Z-domain.

Copyright © 2012 Waqas Akram. All Rights Reserved.

Read Full Post »

Before embarking on a new design, it is important to plan ahead and create a strategy for verifying the correct operation of that design. In the case of designing digital circuitry in a hardware description language (HDL), it is best to begin with the testbench before creating the actual design itself. In this way, as the design evolves, the testbench can be continuously modified to actively verify the incremental changes as they occur.

When designing a testbench, file input/output can be an extremely useful feature in order to read-in stimulus data from a file, and write-out results to another file. This allows one to create stimulus and verify correctness of results outside the actual language domain used for designing the block. For example, when designing a DSP system, it is common to use a high-level modeling tool such as Matlab to create and model the system. When a particular portion of the datapath is implemented in RTL, the stimulus at the input and the expected data at the output can all be written out directly from Matlab. These files can then be fed to the event-driven HDL simulation environment of the block and testbench in order to ensure direct equivalence between the two embodiments of the design.

For example, the following Matlab commands can write out the elements of a vector Vstim as single integers on each line in the text file named “teststim.txt”:

% create the vector of integers
Vstim = [5, -3, 19, 7, -13, 10];
% open the file in 'write' mode
FID = fopen('teststim.txt','w');
% write the vector to the file, one element per line
fprintf(FID,'%d\n',Vstim)
% close the file
fclose(FID)

The file “teststim.txt” should now contain the following:

5
-3
19
7
-13
10

Reading and writing files in VHDL is a fairly straight-forward process, but some details need to be settled before proceeding. There are multiple approaches to the read and write flow in a testbench: all-at-once, just-in-time, or some mixture of both. This decision can have an effect on simulation time and size, and also depends on the amount of data involved at each end.

For example, one approach might be to read-in the entire stimulus file before presenting each element to the device under test (DUT) on a clock-cycle to clock-cycle basis. Another approach might be to read-in only what is required for each cycle and waiting until the next element is actually required. Similarly at the output side, data can either be written out as it is produced by the DUT, or it can be saved until the simulation is complete, and then written out all at once. The following is a description of an example VHDL testbench which performs file I/O. It is missing a DUT, but it illustrates file I/O in VHDL.

The first thing to be declared is the testbench entity. Since the testbench is the top-level module, the entity declaration is empty. This is followed by library declarations and the definition of the testbench architecture. The internal constants and signals are described within the code comments:

-- entity declaration for testbench named "fileio"
entity fileio is
end fileio;

-- library declarations
library STD, IEEE;
-- needed for the write and read calls
use STD.textio.all;
-- needed for std_logic data types
use IEEE.std_logic_1164.all;
-- needed for calls to WRITE(LINE, std_logic)
use IEEE.std_logic_textio.all;
-- needed for calls to CONV_STD_LOGIC_VECTOR
use IEEE.std_logic_arith.all;

-- definition of architecture "BEH" for testbench "fileio"
architecture BEH of fileio is

    constant CLK_PERIOD : time := 5 ns; -- period of system clock
    constant DATA_WIDTH : integer := 6; -- width of data vector

    -- definitions of input and output file names and access types
    file INPUT_FILE     : TEXT open READ_MODE is "teststim.txt"; 
    file OUTPUT_FILE    : TEXT open WRITE_MODE is "testout.txt";
    
    signal clk_sys      : std_logic := '0'; -- system clock
    signal eof          : std_logic := '0'; -- flag end of file
    signal read_en      : std_logic := '0'; -- enable reading
    signal write_en     : std_logic := '0'; -- enable writing

    -- data vector for representing stimulus integers
    signal current_data_vec : std_logic_vector(DATA_WIDTH-1 downto 0) 
        := (others=>'0');

begin -- begin body of architecture BEH

      -- [ THIS IS WHERE ALL PROCESSES GO, AS DEFINED BELOW ]

end BEH; -- end body of architecture BEH

The system clock is defined in order to provide a cyclic reference point for all operations, including reading and writing data. There is a constant declaration for the clock period (arbitrarily defined as 5 ns in this example). The following VHDL line defines the system clock with a perfect 50% duty-cycle:

    -- create the system CLOCK
    clk_sys <= not clk_sys after CLK_PERIOD/2;

The main control process is where the testbench is controlled, and in this example, the process lacks a sensitivity list. A process without a sensitivity list simply executes code sequentially and repeats indefinitely (until the simulation is terminated). In the case of this example, the simulation is terminated using a “fake” assertion failure, in order to allow the testbench to work on arbitrarily-long stimulus files.

    -- MAIN CONTROL process
    main_control:
    process
    begin
        -- wait until the next rising clock edge
        wait until clk_sys'event and clk_sys='1';
        read_en <= '1'; -- enable reading
        -- delay writing to the output file by one clock cycle
        wait for CLK_PERIOD;
        write_en <= '1'; -- enable writing
        -- wait for the eof flag to go high
        wait until (eof='1');
        wait for CLK_PERIOD;
        -- close both files
        file_close(INPUT_FILE);
        file_close(OUTPUT_FILE);
        -- terminate the simulation
        assert false
            report "INFO: this is used to terminate the simulation"
            severity failure;
    end process main_control;

The read process is sensitive only to the system clock, responds on every rising edge of the system clock and continues to read while reading is enabled. This process keep reading until end-of-file is reached. Reading is enabled through the “read_en” signal, and end-of-file is indicated through the “eof” signal. Data is converted to a vector so the DUT can process the digital representation of the data.

    -- READ FILE process
    read_from_file:
    process (clk_sys) is
        variable tmp_line : line;
        variable tmp_int : integer;
    begin
        if (clk_sys'event and clk_sys='1' and read_en='1' 
	    and eof='0') then
            if endfile(input_file) then
                -- place the status string into a line
                write(tmp_line, string'("INFO: reached end of file"));
                -- write the line to the output
                writeline(output, tmp_line);
                -- update the flag
                eof <= '1';
            else
                -- read the next line in the file
                readline(INPUT_FILE, tmp_line);
                -- parse the line and convert data to integer
                read(tmp_line, tmp_int);
                -- convert the integer to vector and assign to a signal
                current_data_vec <= 
                    CONV_STD_LOGIC_VECTOR(tmp_int,DATA_WIDTH);
                -- maintain the flag
                eof <= '0';
            end if;
        end if;
    end process read_from_file;

The write process is sensitive only to the system clock, responds on every rising edge of the system clock and continues writing until one clock cycle after the end-of-file is reached in the stimulus file. This single-cycle delay at the end is specified in the main control process, and can be adjusted according to the desired latency through the DUT.

    -- WRITE FILE process
    write_to_file:
    process (clk_sys) is
        variable tmp_line : line;
    begin
        if (clk_sys'event and clk_sys='1' and write_en='1' 
	    and eof='0') then
            write(tmp_line, current_data_vec);
            writeline(OUTPUT_FILE, tmp_line);
        end if;
    end process write_to_file;

The above testbench can be easily be compiled and simulated using GHDL (as outlined in this post) using the following shell script:

# Compile the vhdl file
wine ghdl.exe -a --ieee=synopsys fileio.vhd
# Elaborate the testbench
wine ghdl.exe -e --ieee=synopsys fileio
# Simulate the testbench
wine ghdl.exe -r --ieee=synopsys fileio

When the simulation is run, the shell output should look something like this:

INFO: reached end of file
fileio.vhd:52:9:@42500ps:(assertion failure): INFO: this is used to terminate the simulation
C:\Program Files\Ghdl\Bin\ghdl.exe:error: assertion failed
C:\Program Files\Ghdl\Bin\ghdl.exe:error: simulation failed

The output file “testout.txt” should contain the following lines of signed integer converted to a two’s complement representation of the contents of “teststim.txt”.

000101
111101
010011
000111
110011
001010

In this example the digital data is being written directly to the output file in order to illustrate file I/O. In reality, it would be more convenient to convert the output of the DUT back to a signed integer before writing to the output file, thereby allowing Matlab to easily process and verify the output.

This type of testbench is just the first step to block-level design. The next step would be to actually design and instantiate the block (or DUT) into the testbench, taking care of any interface requirements. Throughout the design process, the testbench will have to keep up with the signalling needs of the block to be tested, as the needs arise.

Copyright © 2010-2012 Waqas Akram. All Rights Reserved.

Read Full Post »
Today was spent preparing and presenting my paper (co-authored with my doctoral adviser, Prof. Earl E. Swartzlander, Jr.) entitled A novel technique for Tunable Mismatch Shaping in Oversampled Digital-to-Analog Converters, during a poster session at the 2010 IEEE International Conference on Acoustics, Speech and Signal Processing (ICASSP). The poster session was titled DISPS-P1: Analog and Digital Signal Processing Systems, and provided an opportunity to spend time with researchers working on many other interesting topics. My poster was positioned right next to Professor Mark Arnold, who was presenting his poster on Implementing LNS using Filtering Units of GPUs, and I was quite fascinated to hear that GPUs were now being leveraged for real-time co-processing applications in order to eke out more processor performance.

Located in the heart of downtown Dallas, the Sheraton hotel is as unexciting a conference hotel as they come, with more than adequate facilities for big gatherings, but little else on offer. it didn’t help that the limited selection of restaurants and coffee shops in the vicinity left much to be desired. The conference itself was quite well-attended, and as is to be expected, with a very significant proportion of papers and posters having to do with speech and audio processing. The word of the day was most certainly Compressive Sensing (CS), an area of research pioneered at my alma mater, Rice University, and the talks featuring CS were by far the most heavily-attended.

I enjoyed the experience of presenting my research to others, particularly those whose work was so far removed from mine that I found myself resorting to first principles in order to convey the fundamental ideas. A pre-publication version of the paper can be downloaded here (pdf).

From the abstract:

Over-sampled digital-to-analog converters typically employ a unit-element architecture to drive out the analog signal. Performance can suffer from errors due to mismatch between unit elements, leading to a sharp drop in the achievable signal-to- noise ratio (SNR). Mismatch noise shaping is an established technique for overcoming these limitations, but usually anchors the signal band to a fixed location. In order to extend these advantages to tunable applications, this paper presents a novel technique that allows the mismatch noise shaping transfer function to have an adjustable center frequency.

Edit-2011: The paper is now available on IEEExplore.

Read Full Post »

My paper entitled A novel technique for Tunable Mismatch Shaping in Oversampled Digital-to-Analog Converters has been accepted for presentation at the 2010 IEEE International Conference on Acoustics, Speech and Signal Processing (ICASSP). The conference takes place from March 14-19, 2010, at the Sheraton Dallas Hotel in Dallas, Texas. ICASSP is a technical conference focusing on signal processing theory and its applications. In its 35th year, the conference is expected to feature over 120 lecture and poster sessions.

Read Full Post »

This is a continuation of a discussion about quantization and analog-to-digital converters. In that discussion, the normalized quantization step through an N-bit ADC was denoted q, where q = 1/2N. The ADC encoder transfer function yielded a quantization error range over the interval [-q/2,+q/2].

Quantization is a highly nonlinear process. Denoting the input and output of a quantizer as u[n] and uq[n], respectively, the error from quantization uq[n]-u[n] can be re-arranged to yield the additive noise model of quantization error: uq[n]=u[n]+e, where e is the quantization error.

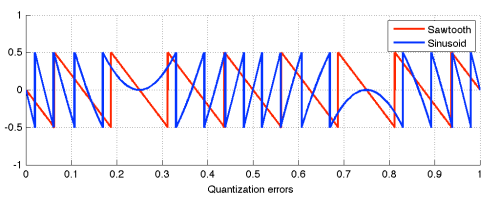
The figure below shows the quantization error for a full-scale sine wave over a single period. Also shown is the quantization error for a full-scale sawtooth ramp signal.

Although the quantization error from the sinusoid is signal-dependent and nonlinear, the commonly used additive noise model assumes a stochastic process in order to simplify the analysis. In particular, the error is treated as an independent and identically distributed (i.i.d.) random variable.

If the quantization error is modeled as a random variable with a uniform distribution, the probability density function is given by:

p(e) = \begin{cases}              0, & x \mbox{ \textless } -q/2 \\            1/q, & -q/2 \leq x \leq +q/2 \\              0, & x \mbox{ \textgreater } +q/2          \end{cases}

The root mean-square (RMS) quantization error with such a distribution can thus be derived:

\begin{array}{lcl}  e_{RMS}^2 & = & E(e^2) \\       	  & = & \int\limits_{-q/2}^{+q/2} e^2 \cdot p(e) \,d e \\       	  & = & \frac{1}{q} \int\limits_{-q/2}^{+q/2} e^2 \,d e \\       	  & = & \frac{q^2}{12} \\    e_{RMS} & = & \frac{q}{\sqrt{12}}  \end{array}

The RMS value of a full-scale sinusoid whose peak-to-peak swing has been normalized to unity is given by:

sig_{RMS} = \frac{1}{2\sqrt{2}}

The signal-to-quantization-noise ratio (SQNR) through the ADC can then be computed and expressed in decibels (dB) as:

\begin{array}{lcl}  SQNR_{sig} & = & 10log_{10} \left( \frac{sig_{RMS}}{e_{RMS}} \right)^2 \\             & = & 10log_{10} \left( \frac{1}{2\sqrt{2}} / \frac{q}{\sqrt{12}} \right)^2  \end{array}

Substituting q=1/2N gives:

\begin{array}{lcl}  SQNR_{sig} & = & 10log_{10} \left( 2^N \cdot \sqrt{3/2} \right)^2 \\             & = & 20log_{10} \left( 2^N \right) + 20log_{10} \left( \sqrt{3/2} \right) \\             & = & (6.02N + 1.76) dB  \end{array}

This is the well-known equation for SNR or dynamic range through an N-bit ADC using the additive noise model of quantization error, and in the absence of all other noise sources like thermal noise in the analog circuitry, dither and sampling jitter. Note that no over-sampling is assumed here.

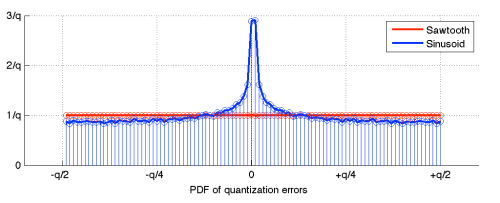
This analysis assumes that quantization errors are uniformly distributed over the quantization interval. In reality, the errors are not uniformly distributed for a sinusoidal input. For example, referring back to the time-domain quantization error from a sinusoid and a sawtooth ramp shown in the figure above, the respective error distributions are shown in the figure below.

The quantization error of the sawtooth wave appears to be uniformly distributed, but that of the sinusoid is clearly not. This is due to the signal-dependence of the sinusoid’s quantization error. Since the sawtooth actually produces uniformly distributed quantization errors, it is instructive to compute the SQNR from quantizing such a signal.

The RMS value of a full-scale sawtooth whose peak-to-peak swing has been normalized to unity is given by:

saw_{RMS} = \frac{1}{2\sqrt{3}}

Using the RMS quantization error derived above for a uniformly distributed quantization error, the SQNR of a sawtooth wave applied to an ADC can be expressed as:

\begin{array}{lcl}  SQNR_{saw} & = & 10log_{10} \left( \frac{saw_{RMS}}{e_{RMS}} \right)^2 \\             & = & 10log_{10} \left( \frac{1}{2\sqrt{3}} / \frac{q}{\sqrt{12}} \right)^2 \\             & = & 10log_{10} \left( 2^N \right)^2 \\             & = & (6.02N) dB  \end{array}

In general, the computed SQNR depends on the signal source and the model used for the quantization error. For sinusoidal inputs, the approximation of uniformly distributed quantization error improves as the ADC precision increases.

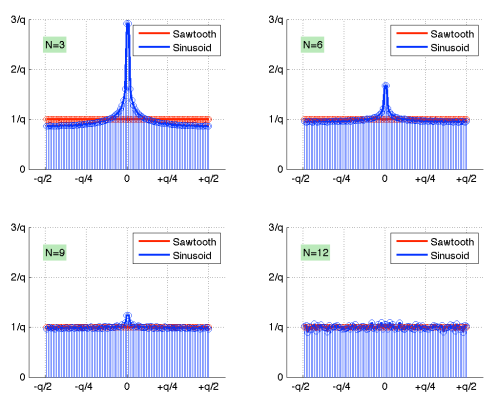
The figure below compares the error distribution of the sawtooth with that of four ADC resolutions (3 bits, 6 bits, 9 bits, and 12 bits). Clearly, the distribution approaches the quantization model of a sawtooth as the ADC resolution is increased.

Modeling the SQNR as 6dB per bit of ADC precision is a good approximation, especially as the ADC precision asymptotically increases. For many signal processing applications, the usefulness of approximating the quantization error as an i.i.d. noise source, far exceeds the inaccuracy of the model.

Copyright © 2008 – 2012 Waqas Akram. All Rights Reserved.

Read Full Post »

The use of the decibel scale is ubiquitous in electronic systems. For example, the dynamic range through a system is measured by the signal-to-noise ratio in decibels, or dB. When working in the lab, or viewing the output of any measurement device, it is useful know how to make quick mental conversions between the linear and dB scales.

The amplitude or power of a signal is typically quantified relative to a fixed reference. A full-scale signal has a ratio of 1:1, and is expressed as 20.log(1/1) = 0 dB. Remember that multiplication (division) in the linear domain is equivalent to addition (subtraction) in the log domain. One needs to only remember a few values in order to compute most conversions:

  1. A ten-fold (10x) increase or decrease in linear signal amplitude results in a +20 dB or -20 dB change on the decibel scale, respectively.
  2. A doubling or halving (2x or ½x) of linear signal amplitude results in [approximately] a +6 dB or -6 dB change on the decibel scale, respectively.
  3. A tripling (3x) of linear signal amplitude can be approximated by using 3 ≈ √10. The square-root is equivalent to a power of half, and in the log domain, this simply halves the dB value. This results in ½ x 20 dB = 10 dB.

Using these basic rules, it is easy to quickly compute the linear ratios corresponding the dB value. Note that in the list above, the 3x ↔ 10 dB conversion is the greatest source of error in the final approximation.

Some examples:

  • Convert 54 dB to the linear scale: note that 54 dB = (60 – 6) dB, which is equivalent to 1000 x ½ = 500 in the linear domain (this is a good approximation to the actual value of 501.2)
  • Convert 7x to the dB scale: note that 7 = √49 ≈ √50 = √(100 x ½), which is equivalent to ½ x (40 – 6) = 17 dB (the answer should be 16.9)
  • Convert 30 dB to the linear scale: note that 30 dB = (20 + 10) dB, which is equivalent to (10 x 3) = 30 in the linear domain (the answer should be 31.6). Alternatively, we can use 30 dB = (40 – 10) dB, which converts to (100 ÷ 3) = 33.3 (the magnitude of the approximation error is about the same as that of the first answer)

In the computerized world of today (or when no one brings a calculator to the lab), these mental shortcuts can be very useful as a quick sanity check.

Copyright © 2008 – 2012 Waqas Akram. All Rights Reserved.

Read Full Post »